
Features
Construction Reporting & Analytics
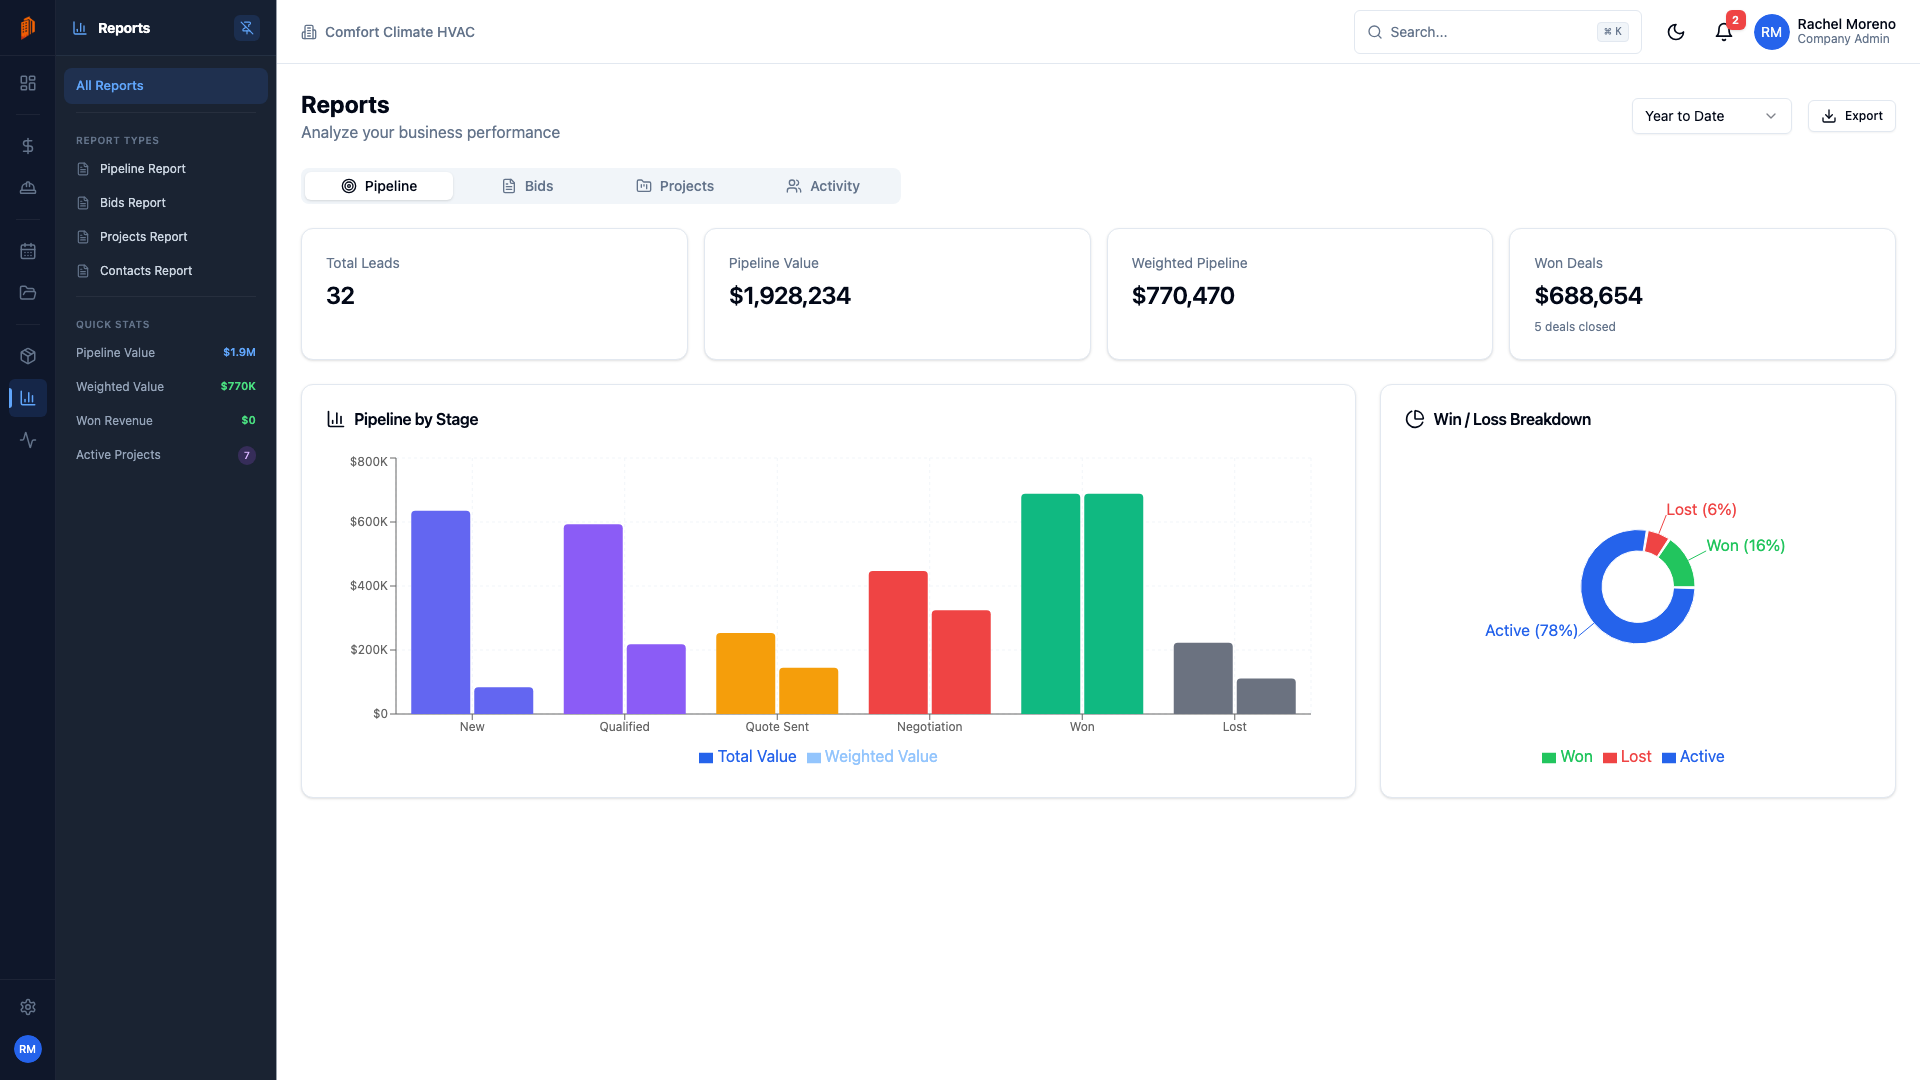
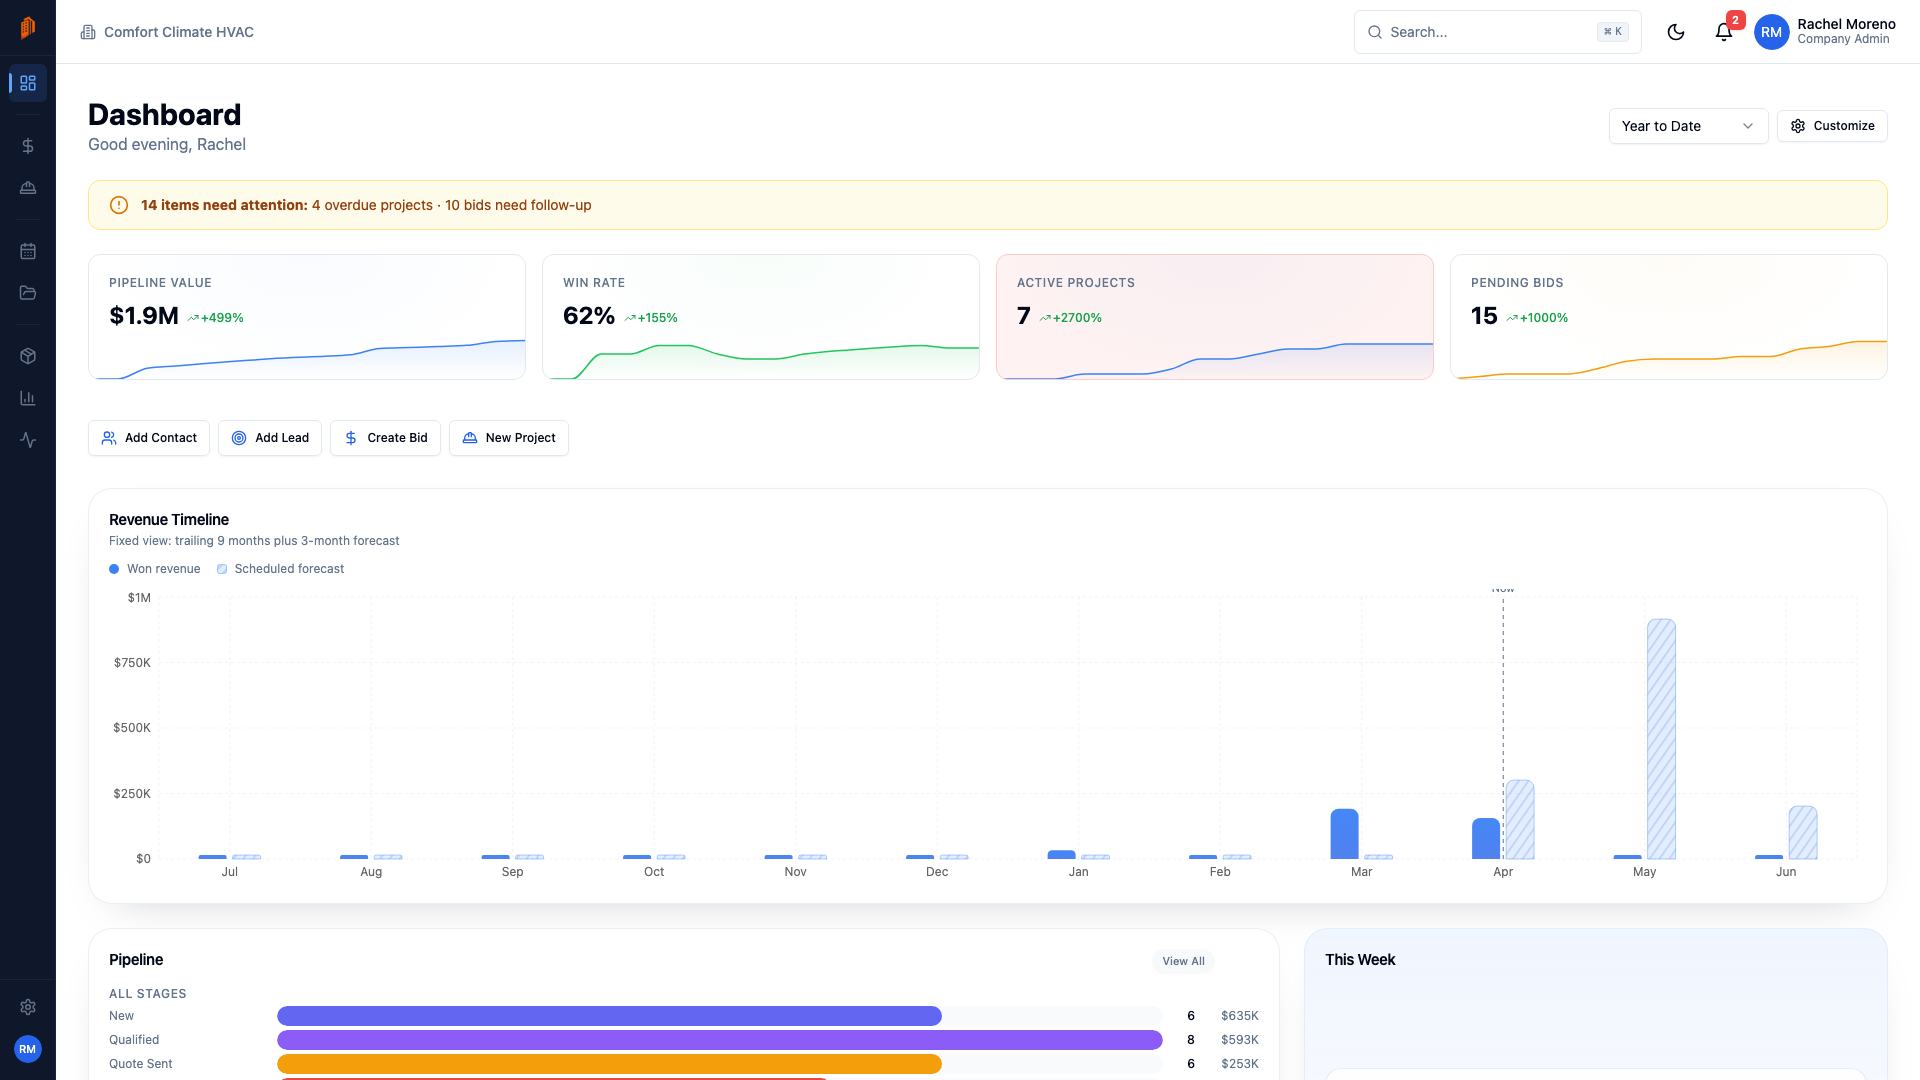
A business review built from the records your team already keeps: what you sold, billed, collected, and are owed for any period, with reports for AR aging, bid performance, pipeline, and work in progress — so you know how much you quoted, how much you won, and who still owes you.
Replace gut feel with your own numbers
Most subcontractors find out how the year went when they look at the bank account in December. You know which months felt busy — not how much of what you quoted actually converted, or who is sitting on your money. The Reports module turns the data you already enter into a business review — sold, billed, collected, and owed for the period — and five reports: AR aging, billed vs collected, bid performance, pipeline by source, and WIP / backlog.
The numbers start where the work starts. Every estimate you build in bidding feeds bid performance — bids sent, won, and lost, win rate, and won value by estimator, customer, and month — so your win rate is a number, not a hunch. And because reports live in the same system as your pay applications and time tracking, reporting is a byproduct of running jobs, not a separate chore.
A period selector at the top scopes everything to a date range — this week, this month, year to date, last quarter, or a custom range — and compares it with the period before. Each report page exports to CSV. Full details in the Reports docs.
Key capabilities
Business review
Sold, Billed, Collected, and Owed to you for the period, each compared with the period before — the four numbers that say how the business is actually doing.
Bid performance
Bids sent, won, and lost, win rate, won value, and average days to a decision — by estimator, customer, and month. Know how often a sent bid turns into a job.
WIP / backlog
Contract, approved change orders, billed, paid, left to bill, and retainage for every live project — with the days any job has run past its expected end.
Billed vs collected and AR aging
Invoices and pay apps issued against cash received, period by period, and every open invoice by how long it has been due. See who owes you before it becomes a problem.
Period filter
One selector scopes every number and chart to a date range — this month, year to date, last quarter, or a custom range — and compares it with the period before.
Pipeline by source and CSV export
Where leads come from, what they are worth, and how many convert. Every report page exports to CSV — hand your accountant the numbers without retyping anything.
How it works
Run your work as usual
The leads, bids, invoices, pay apps, and projects your team already records are the report data. There is no separate entry step — the reports read what is already there.
Open the Business review
Open Reports from the sidebar to land on the Business review. Each section — money, sales, and work in progress — links to its full report.
Filter the period and export
Scope everything to this month, year to date, or another range, compare it with the period before, and download any report page as a CSV from the Export menu.
Full walkthrough in the docs: Reports · CRM pipeline · Projects overview
Not ready for software? Start with the free templates
The same documents BuildWorkPro generates, as free fillable PDF, Excel and Word templates — no email required.
Frequently asked questions
What reports does BuildWorkPro include?
Reports opens on a Business review: Sold, Billed, Collected, and Owed to you for the period you pick, each compared with the period before, plus a billed-vs-collected chart, who owes you, bids sent vs won, this period’s pipeline, and the backlog of live projects. Five report pages go deeper: AR aging, Billed vs collected, Bid performance, Pipeline by source, and WIP / backlog.
Can I export reports?
Yes. The Export menu on each report page downloads it as a CSV. Whatever period you have selected is what exports, so you can pull this month or year to date without editing anything. Exporting requires the Member role or above.
Where does the report data come from?
From the records your team already keeps in BuildWorkPro. Bids feed bid performance, leads feed the pipeline report, invoices and pay apps feed billed vs collected and AR aging, and projects and their change orders feed WIP / backlog. There is no separate data entry for reporting — the numbers update as your team works.
Who can run reports?
Company Admin, Manager, Member, and Viewer roles can all view reports. Field Crew has no access to the Reports module. Exporting requires Member or above, so a Viewer can look at every report but cannot download the data.
How much does construction reporting software cost?
Reports are included in the single BuildWorkPro plan: $79/month (or $790/year) with unlimited users, unlimited projects, and every feature. There is a 14-day free trial with no credit card required.
Know your numbers before you bid the next job
Reports are included in the $79/month flat plan — unlimited users, every feature. 14-day free trial, no credit card required.
Start free trial