
Reports
The Reports module turns your data into KPI cards and charts. Open it from Reports in the sidebar. A period selector at the top right filters every report to a date range, and you can export what you see.
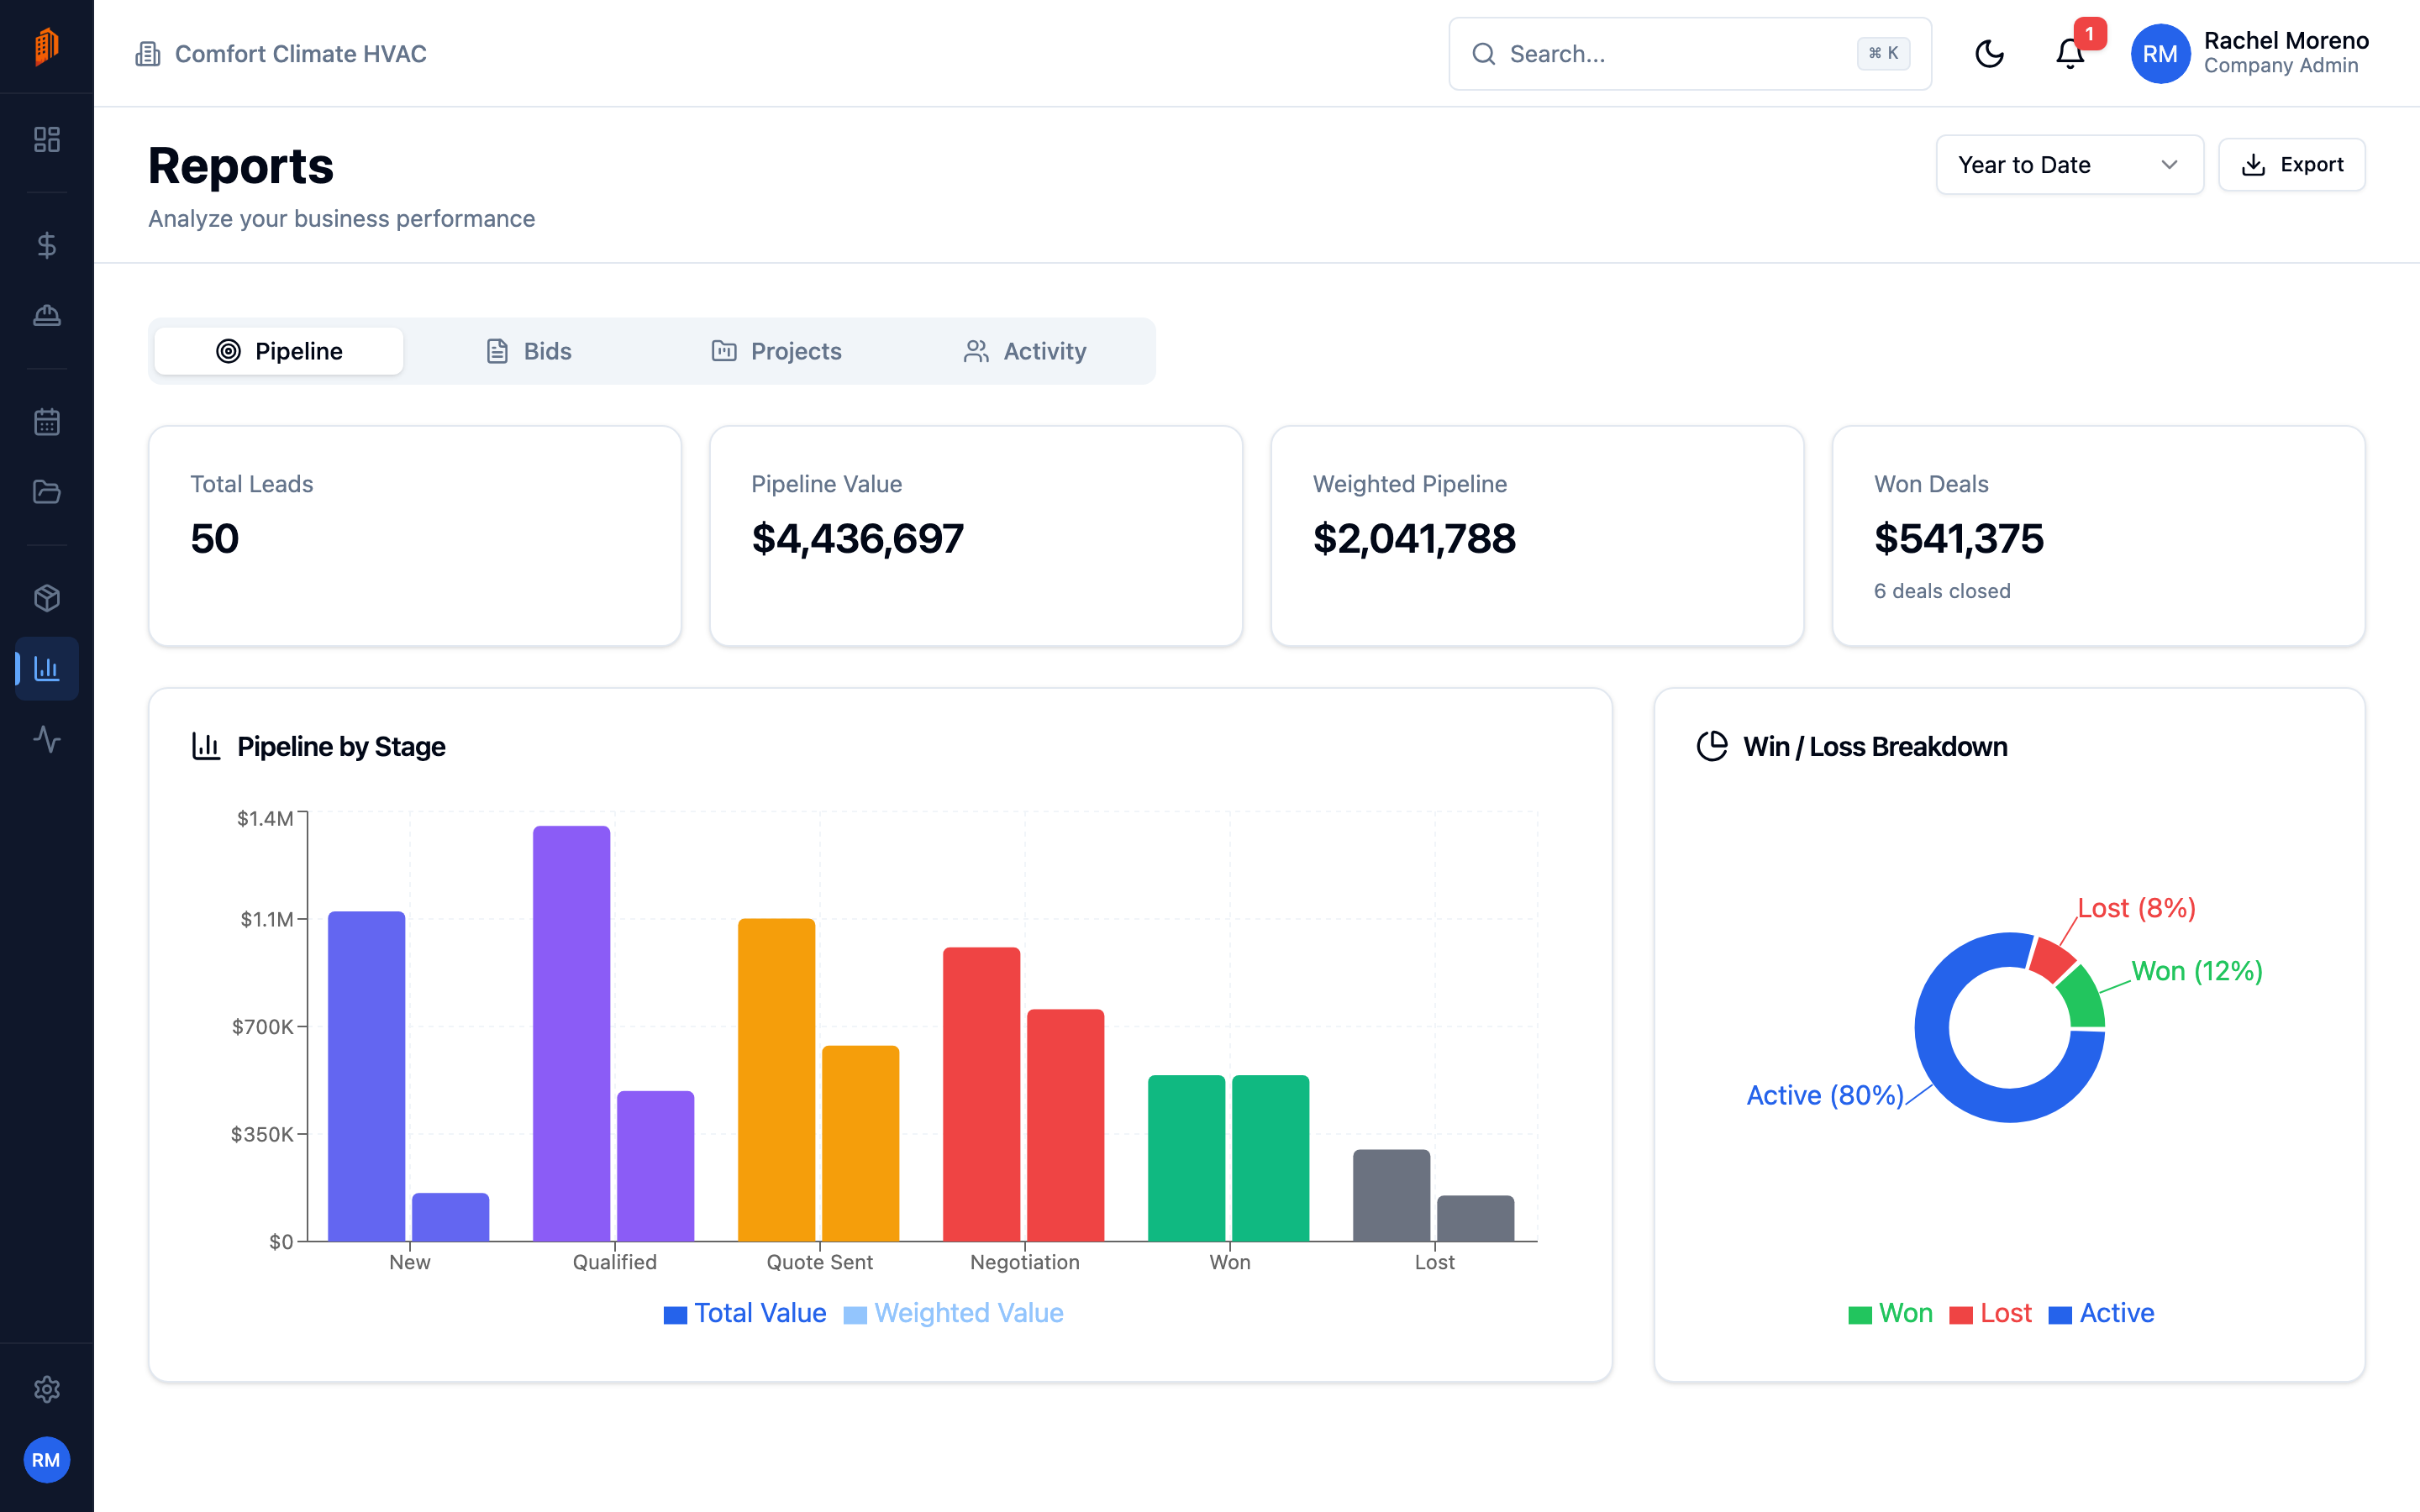
Report tabs
Section titled “Report tabs”Reports are split into four tabs, each with KPI cards and two charts:
- Pipeline – Total Leads, Pipeline Value, Weighted Pipeline, and Won Deals, with pipeline-by-stage and win/loss charts.
- Bids – Total Bids, Conversion Rate, Total Quoted, and Accepted Value, with bids-by-status charts.
- Projects – Total Projects, In Progress, Completed, and Total Value, with status and value-by-type charts.
- Activity – New Contacts and Total Activities, with activity-by-type and new-contacts-by-type charts.
Filter by period
Section titled “Filter by period”Use the period selector to scope every report – this month, year to date, and other ranges. The KPI cards and charts recalculate for the selected window.
Export
Section titled “Export”Open the Export menu to download the current report as a CSV, or print it to save as a PDF.
What’s next
Section titled “What’s next”- CRM pipeline – the leads behind the Pipeline report.
- Projects overview – the projects behind the Projects report.